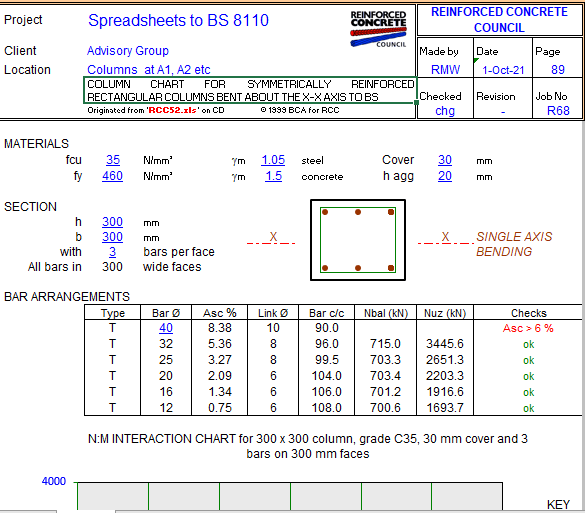
A column chart is a data visualization where each category is represented by a rectangle, with the height of the rectangle being proportional to the values being plotted. Column charts are also known as vertical bar charts
Column charts are useful for showing data changes over a period of time or for illustrating comparisons among items. In column charts, categories are typically organized along the horizontal axis and values along the vertical axis.


